Python & Data Analytics

Python is an interpreted, object-oriented, high-level programming language with dynamic semantics. Its high-level built in data structures, combined with dynamic typing and dynamic binding, make it very attractive for Rapid Application Development, as well as for use as a scripting or glue language to connect existing components together. Python supports modules and packages, which encourages program modularity and code reuse. The Python interpreter and the extensive standard library are available in source or binary form without charge for all major platforms and can be freely distributed.
Data Analytics:
It is one of the fastest growing job sector. Various studies suggests that there are more than 50,000 jobs in both data science and machine learning lying vacant in India and this is a conservative estimate. Some of the top contributing sectors of Data Analytics job markets are 1) Financial services, 2) E-Commerce, 3) Healthcare, 4) Energy and Utilities and, 5)Telecom and Media
Vnurture has a successfully trained and placed hundreds of professional and students to gain insightful knowledge from fundamental concepts, design philosophy of Python to advance topics with hands-on experience.
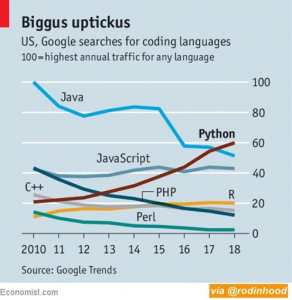
Data Analytics with Python is one of our popular track, for job seekers as well as students, who wants to pursue Masters or PhD degree in Data Science. Python popularity is growing significantly over last decade, as it is evident in a chart by Google Trends (see below)
- A Brief History of Python
- Python Versions
- Installing Python
- Environment Variables
- Executing Python from the Command Line
- IDLE
- Editing Python Files
- Python Documentation
- Getting Help
- Dynamic Types
- Python Reserved Words
- Naming Conventions
- Basic Syntax
- Comments
- String Values
- String Methods
- The format Method
- String Operators
- Numeric Data Types
- Conversion Functions
- Simple Input and Output
- The % Method
- The print Function
- Indenting Requirements
- The if Statement
- Relational Operators
- Logical Operators
- Bit Wise Operators
- The while Loop
- break and continue
- The for Loop
- Lists
- Tuples
- Sets
- Dictionaries
- Sorting Dictionaries
- Copying Collections
- Defining Your Own Functions
- Parameters
- Passing Collections to a Function
- Variable Number of Arguments
- Scope
- Open
- Close
- Append
- Various file functions
- Seak
- Tail
- Modules
- Standard Modules - sys
- Standard Modules - math
- Standard Modules - time
- The dir Function
- Errors
- Run Time Errors
- The Exception Model
- Data Streams
- Creating Your Own Data Streams
- Access Modes
- Writing Data to a File
- Reading Data From a File
- Additional File Methods
- Using Pipes as Data Streams
- Handling IO Exceptions
- Working with Directories
- Metadata
- The pickle Module
- Classes in Python
- Principles of Object Orientation
- Creating Classes
- Instance Methods
- File Organization
- Special Methods
- Class Variables
- Inheritance
- Polymorphism
- Type Identification
- Custom Exception Classes
- The Dot Character
- Grouping
- Matching at Beginning or End
- Match Objects
- Various Examples
- MySQL
- CRUD Operations
- Various Examples
- Built-in database (SQlite) with framework (e.g.. Django)

A Data Analyst uses data visualization and manipulation techniques to uncover insights and help organizations make better decisions.
Learn how to analyze data using Python. learn how to prepare data for analysis, perform simple statistical analysis, create meaningful data visualizations, predict future trends from data, and more!
Data Analysis libraries: will learn to use Pandas, Numpy and Scipy libraries to work with a sample dataset. introduce you to pandas, an open-source library, and we will use it to load, manipulate, analyze, and visualize cool datasets.
NumPy is a commonly used Python data analysis package. By using NumPy, you can speed up your workflow, and interface with other packages in the Python ecosystem, like scikit-learn, that use NumPy under the hood. NumPy was originally developed in the mid 2000s, and arose from an even older package called Numeric. This longevity means that almost every data analysis or machine learning package for Python leverages NumPy in some way.
- Creating an Array
- Reading Text Files
- Array Indexing
- N-Dimensional Arrays
- Data Types
- Array Math
- Array Methods
- Array Comparison and Filtering
- Reshaping and Combining Arrays
Matplotlib is a Python 2D plotting library which produces publication quality figures in a variety of hardcopy formats and interactive environments across platforms. Matplotlib can be used in Python scripts, the Python and IPython shells, the Jupyter notebook, web application servers, and four graphical user interface toolkits.
There are several toolkits which are available that extend python matplotlib functionality. Some of them are separate downloads, others can be shipped with the matplotlib source code but have external dependencies.
- Basemap: It is a map plotting toolkit with various map projections, coastlines and political boundaries.
- Cartopy: It is a mapping library featuring object-oriented map projection definitions, and arbitrary point, line, polygon and image transformation capabilities.
- Excel tools: Matplotlib provides utilities for exchanging data with Microsoft Excel.
- Mplot3d: It is used for 3-D plots.
- Natgrid: It is an interface to the natgrid library for irregular gridding of the spaced data.
pandas is an open source, BSD-licensed library providing high-performance, easy-to-use data structures and data analysis tools for the Python programming language.
pandas is used for data manipulation, analysis and cleaning. Python pandas is well suited for different kinds of data, such as:
- Tabular data with heterogeneously-typed columns
- Ordered and unordered time series data
- Arbitrary matrix data with row & column labels
- Unlabelled data
- Any other form of observational or statistical data sets


